Two Probe Method For Resistivity Measurement Of Insulators, TPX-200C
Product Details:
- Weight 30 Kg Kilograms (kg)
- Color Grey
- Usage Laboratory Experiment
- Application Laboratory Experiment
- Material Electronics
- Click to View more
Two Probe Method For Resistivity Measurement Of Insulators, TPX-200C Price And Quantity
- 1 Set
Two Probe Method For Resistivity Measurement Of Insulators, TPX-200C Product Specifications
- Laboratory Experiment
- Electronics
- Laboratory Experiment
- Grey
- 30 Kg Kilograms (kg)
Two Probe Method For Resistivity Measurement Of Insulators, TPX-200C Trade Information
- Cash Against Delivery (CAD), Cash on Delivery (COD), Cash Advance (CA), Cash in Advance (CID), Cheque, Delivery Point (DP), Telegraphic Transfer (T/T)
- 100 Set Per Month
- 1 Week
- Contact us for information regarding our sample policy
- Complete in all respect
- Australia, North America, South America, Eastern Europe, Western Europe, Middle East, Central America, Asia, Africa
- All India
- ISO 9001: 2015 CE
Product Description
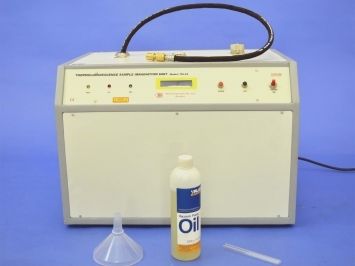
Two Probe Method For Resistivity Measurement Of Insulators,š TPX-200C
With the endorsement of our experienced professionals, we are indulged in supplying, exporting and manufacturing of Two Probe Method For Resistivity Measurement Of Insulators, TPX-200C in Roorkee, Uttarakhand, India.
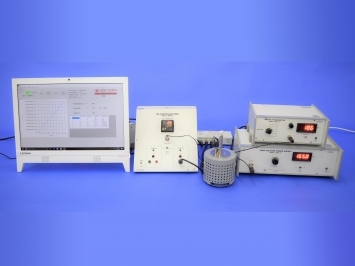
Two Probe Method for resistivity measurement of insulators at different temperatures. The Two Probe Method is one of the standard and most commonly used method for the measurement of resistivity of very high resistivity samples near insulators. The resistivity measurement of such samples is beyond the range of Four Probe Method.
Two Probe Method for resistivity measurement of insulators at different temperatures
The Two Probe Method is one of the standard and most commonly used method for the measurement of resistivity of very high resistivity samples near insulators. The resistivity measurement of such samples is beyond the range of Four Probe Method.
DESCRIPTION OF THE EXPERIMENTAL SET-UP
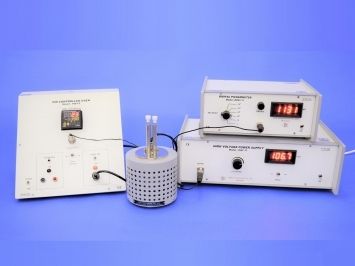
Two Probes Arrangement, TPA-01
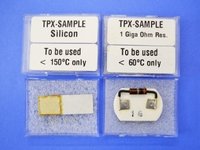
It has two spring load contact probes. These probes move in a pipe and are insulated by PTFE washers. This probes arrangement is mounted in a suitable stand, which also holds the sample plate and RTD sensor. The stand also serves as the lid of PID Controlled Oven. PTFE coated leads are provided for connecting wit High Voltage Power Supply EHT-11C and Digital Picoammeter DPM-111C. With this set-up assuming max. Voltage = 1500V; current 10x10-12 A (max) and thicknexx of sample 1mm, the resistivity of the sample could be measured upto 1014 ohm.cm..
PID Controlled Oven, PID-200C
Specification same as PID-200 given in TPX-01, with extra attachment for connecting computer interface, SES-CAMM
DPM-111C
Specification as per item 3, on page 5 DPM-111 with extra attachement for connecting computer interface, SES-CAMM.
EHT-11C
Specification as per item 4, on page 5 EHT-11 with extra attachement for connecting computer interface, SES-CAMM.
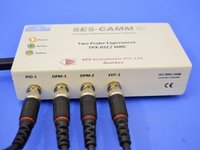
š Computer Interface, SES-CAMM
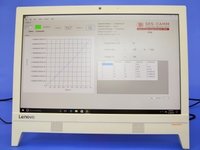
An interface (SES-CAMM) provides the option to the user to interface it with the computer for acquiring and strong the data (temperature, current and voltage) and plotting in real time. The data is also stored in an excel file which can be used for further analysis. The software is menu driven and can be operated very easily.
The experiment is complete in all respect

Price:
- 50
- 100
- 200
- 250
- 500
- 1000+
 English
 Spanish
 French
 German
 Italian
 Chinese (Simplified)
 Japanese
 Korean
 Arabic
 Portuguese



 Send Inquiry
 Send SMS
